How do automated reusable cup return stations perform during long-term deployment? This case study examines ongoing seasonal operation at Tyršák in Bratislava, with 42,528 reusable cup returns recorded across 21,403 collection sessions in the available June -September 2026 data.
The deployment offers a view of reusable cup returns in an everyday hospitality setting: steady use across a season, changing evening demand and occasional days with more than 1,000 returned cups.
Tyršák deployment at a glance
| Metric | Recorded result |
| Location | Tyršák, Bratislava, Slovakia |
| Venue type | Seasonal riverside leisure and hospitality venue |
| Available data periods | 4 June–6 July and 16 July–20 September 2026 |
| Reusable cups returned | 42,528 |
| Collection sessions | 21,403 |
| Seasonal deployment | Two Smart DRS return stations from mid-July |
| Busiest return hour | Around 21:00 |
| Highest recorded day | 22 July: 1,216 cups |
Data for 7–15 July was not available. The combined figures represent the recorded periods, not an uninterrupted count for every day between 4 June and 20 September.
The challenge: a return system for everyday venue use
A seasonal city venue has a different return pattern from a festival. There is no single closing moment when everyone leaves at once. Visitors arrive for different activities, stay for different lengths of time and return their cups throughout the day and evening.
Tyršák is open from 11:00 to midnight on weekdays and from 9:00 to midnight on weekends. Return infrastructure therefore needs to serve visitors across long operating hours, from daytime activities to late-evening hospitality.
That makes the return experience part of normal venue operations. Visitors need a clear place to return eligible cups without waiting for bar staff to handle each deposit. Operators need a process they can run repeatedly and measure over time, including on busier evenings.
Tyršák provided an opportunity to observe how automated returns perform across this longer operating rhythm.

From a one-day event to seasonal operation
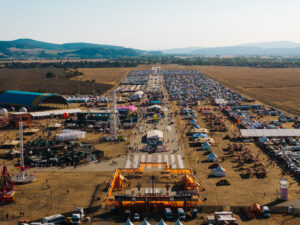
Smart DRS was used at Tyršák during Forbes Business Fest Bratislava on 4 June 2026. That event recorded 687 returned cups in 408 collection sessions.
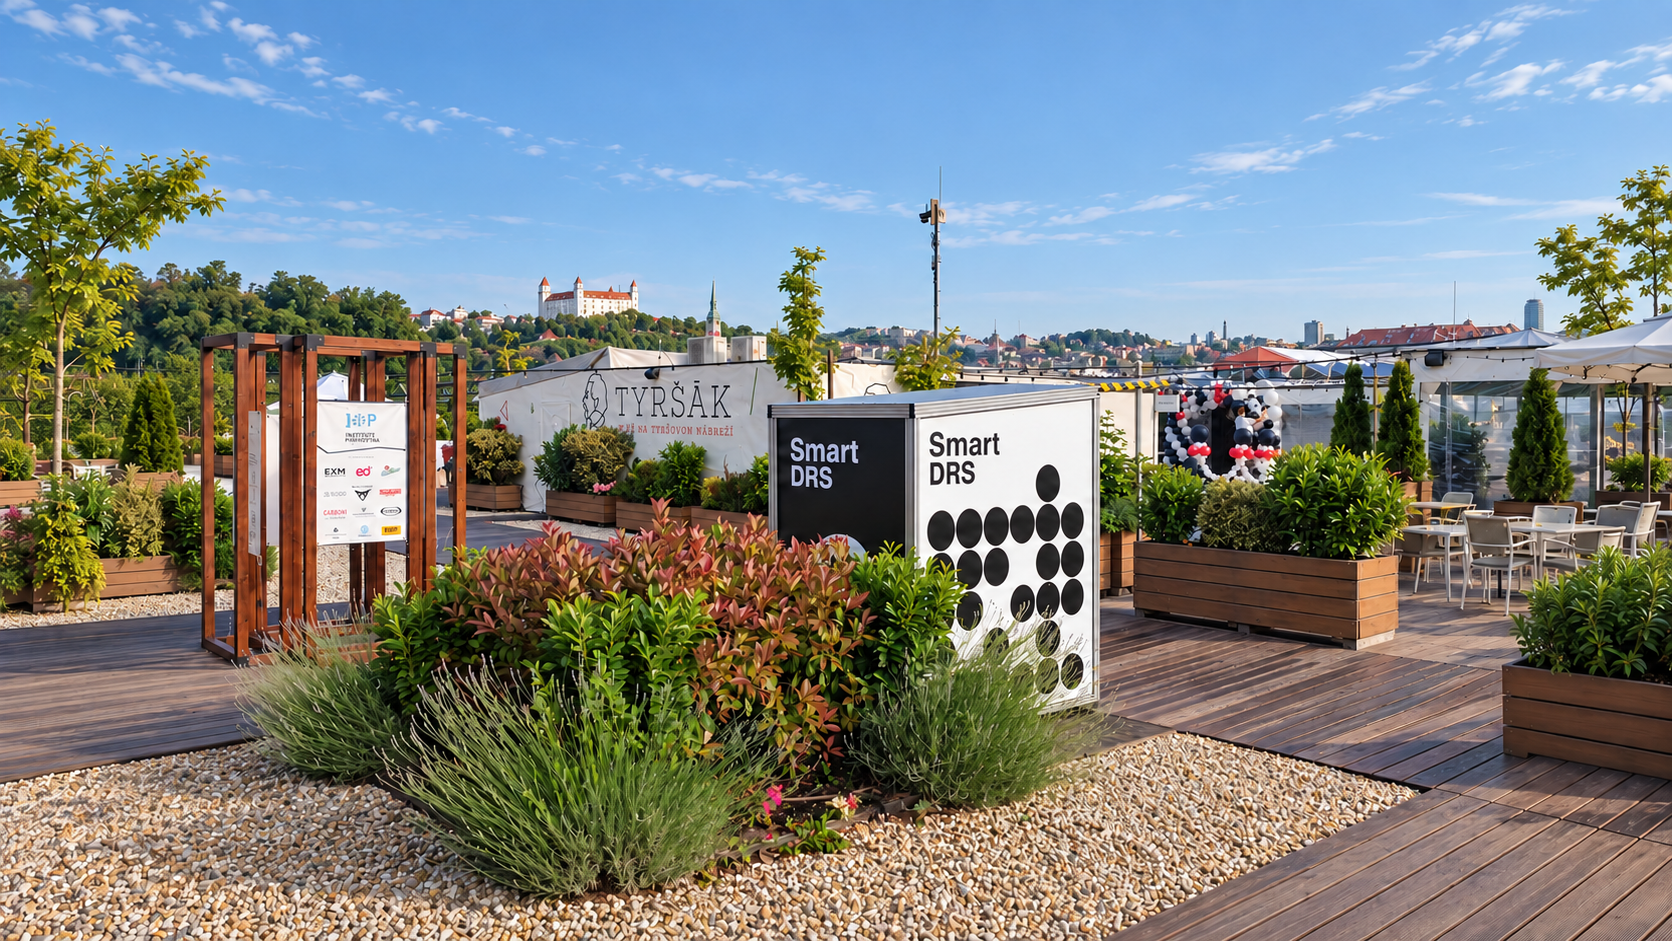
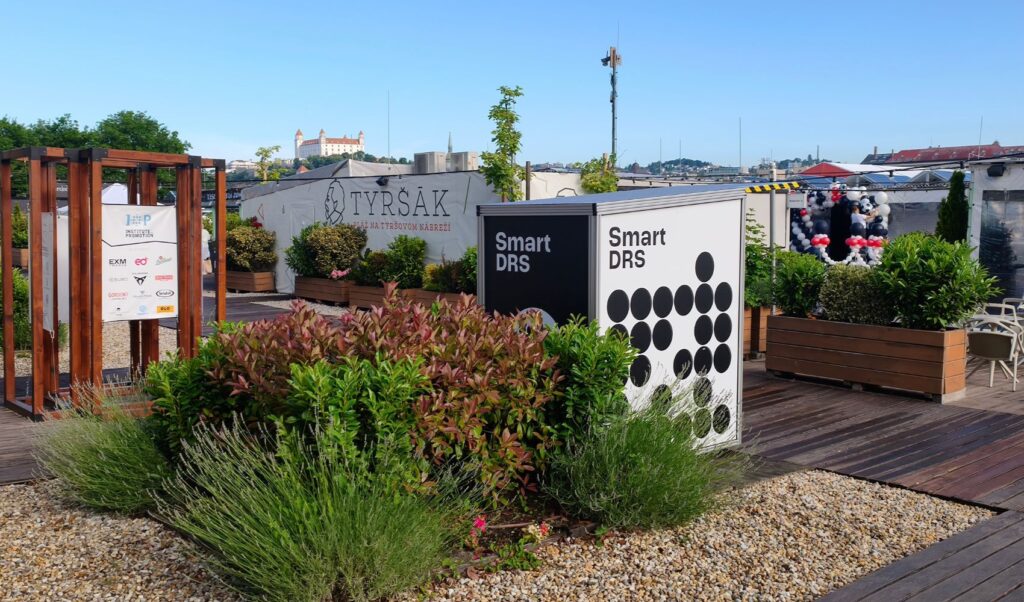
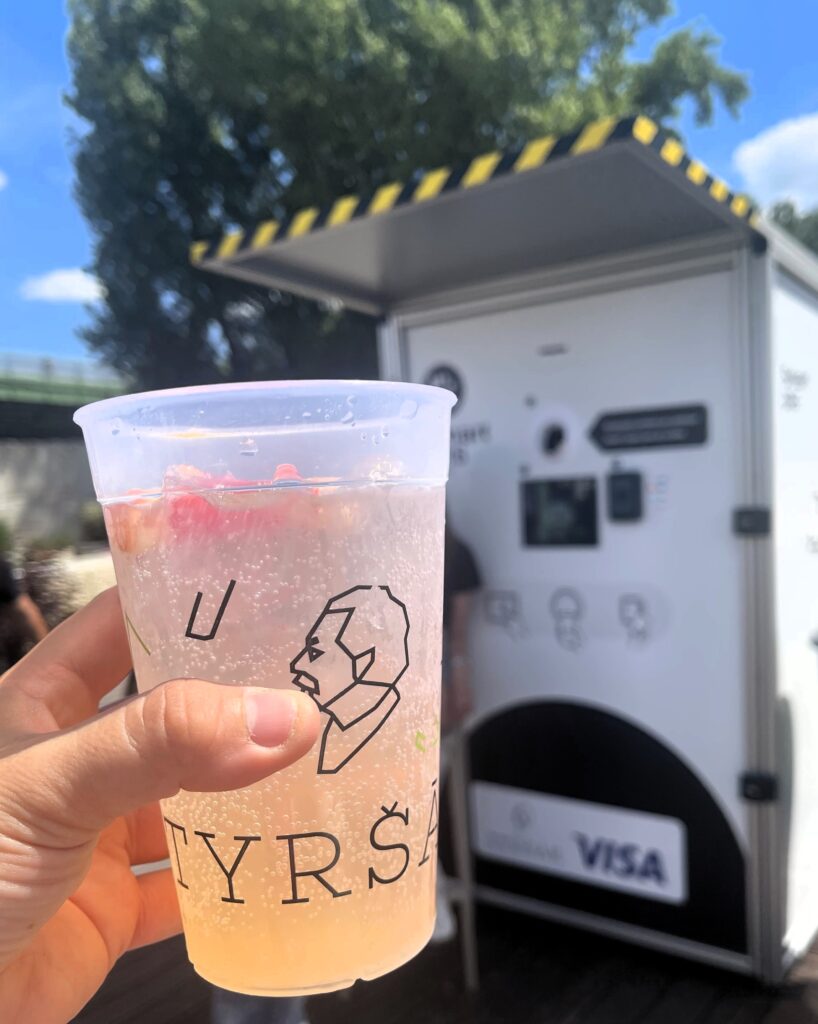
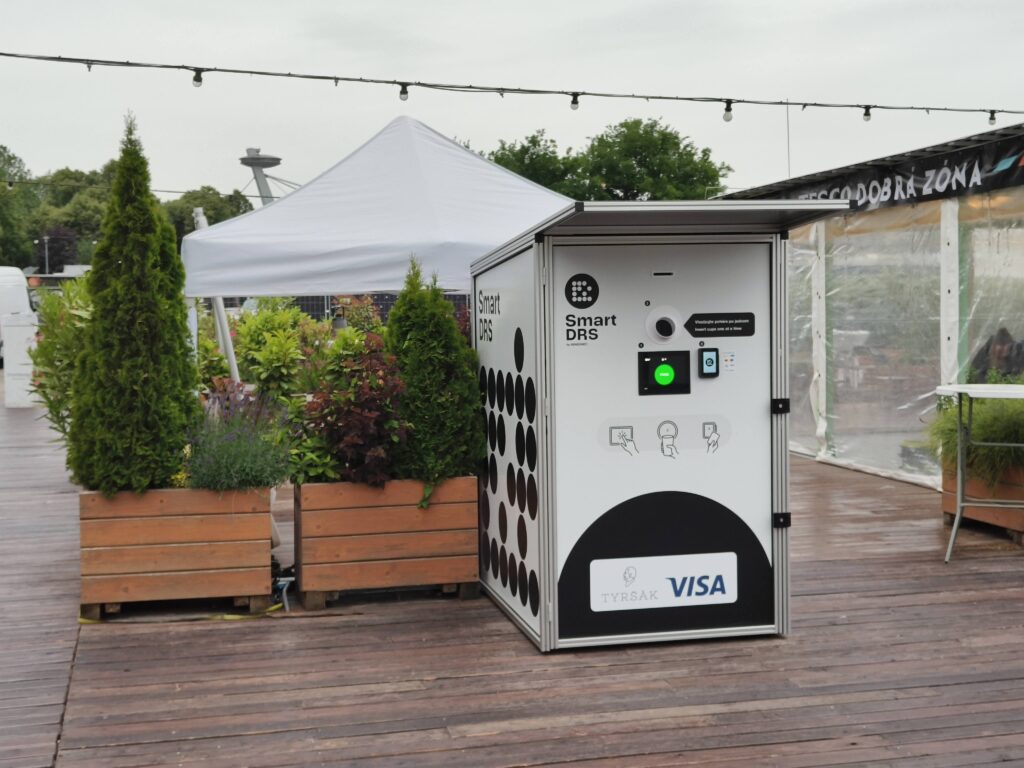
The venue then became a longer-running deployment. From mid-July, two Smart DRS return stations operated at Tyršák during its summer season. Visitors could return eligible reusable cups through the stations and receive their deposit directly to a payment card, without an app or account registration. The deployment was also supported by Visa, highlighting the role of convenient cashless refunds in making reusable packaging returns part of everyday venue operations.
These are two distinct uses of the same location: a one-day business event and regular operation at a seasonal venue. The case study below focuses on what the longer observation period reveals about return behaviour.

Results across the available summer data
The supplied dataset contains two recorded periods:
| Period | Cups returned | Collection sessions | Busiest return hour |
| 4 June–6 July | 8,829 | 4,078 | Around 20:00 |
| 16 July–20 September | 33,699 | 17,325 | Around 21:00 |
| Combined recorded periods | 42,528 | 21,403 | Around 21:00 |
The second period alone accounted for 33,699 returned cups. Return activity was not uniform: 22 July reached 1,216 cups, while 12 August recorded 1,018 and 7 August recorded 1,006.
The busiest return hour in the combined data was around 21:00 three hours before the venue’s published closing time. This shows that returns were already concentrated during regular evening operation, rather than occurring only at closing. The available data does not establish what caused the peak.
Similar total, different operating rhythm: Tyršák and LOVESTREAM Festival
The contrast with LOVESTREAM Festival puts Tyršák’s results into perspective. Smart DRS recorded 42,585 reusable cup returns at LOVESTREAM over a three-day festival. The available Tyršák data records 42,528 returns across two periods spanning much of the summer, only 57 fewer cups in total.
The similar headline figures describe very different demands on return infrastructure.
| Tyršák | LOVESTREAM Festival | |
| Recorded cup returns | 42,528 | 42,585 |
| Collection sessions | 21,403 | 21,427 |
| Operating pattern | Recurring use at a seasonal venue | Concentrated three-day festival |
| Busiest recorded period | Around 21:00 | Around midnight |
| Return infrastructure | Two stations in seasonal operation from mid-Jul | Nine Dual stations with 18 return points |
At LOVESTREAM, capacity had to follow large crowds moving between stages and returning cups in pronounced evening and late-night waves. At Tyršák, the challenge was to keep the return process available through regular venue operation while preparing for individual busy days. On 22 July alone, Tyršák recorded 1,216 returned cups.
The comparison is therefore about the shape of demand, not which deployment performed better. Total returns cannot establish a return rate without knowing how many cups were served, and the Tyršák dataset does not cover every day between June and September.
Operational lessons for seasonal hospitality venues
Plan for the busiest day as well as routine use
From 16 July to 20 September, Tyršák recorded 33,699 returns. The highest day reached 1,216 cups. A seasonal venue should review its busiest days when planning station access, internal storage and collection frequency; a season-wide total alone does not show when pressure on the system occurs.
Keep the return journey available into the evening
The busiest return period in the combined Tyršák data was around 21:00. Return-point visibility, access and collection arrangements should therefore be checked against the venue’s evening operating hours. The data shows when returns concentrated, although it does not identify the reason for a particular evening’s peak.
Use sessions and cup volumes together
Tyršák’s 21,403 collection sessions represent visitor interactions with the system; 42,528 returned cups represent the volume collected. Both measures are useful. Session counts inform how often people approach the stations, while cup volumes matter for storage, collection and washing logistics.
Review each station’s contribution before changing the setup
The current dataset gives venue-wide totals but no breakdown by station. Device-level figures would show whether the two locations received similar use or whether one handled a disproportionate share. That would provide a stronger basis for adjusting placement, signage and servicing in a future season.
What Tyršák demonstrates
Tyršák shows that a seasonal venue needs return infrastructure for two operating conditions at once: regular use across long opening hours and occasional days with much higher volumes. Its recorded total came close to LOVESTREAM’s three-day result, but accumulated across a very different visitor journey. For venue operators, the useful question is therefore not only how many cups a system can collect, but when returns occur and whether the setup remains practical throughout the season.
Frequently asked questions
How many reusable cups were returned at Tyršák?
The available Smart DRS data records 42,528 reusable cup returns across 4 June–6 July and 16 July–20 September 2026. Data for 7–15 July was not available, so the figure should not be described as a complete count for every day of that span.
How many return stations were installed at Tyršák?
Two Smart DRS stations operated at Tyršák as part of its seasonal setup from mid-July 2026. Smart DRS had also supported Forbes Business Fest at the same location on 4 June.
When did most visitors return their cups?
The busiest return period in the combined recorded data was around 21:00. The highest recorded day was 22 July, with 1,216 cups returned.
Did visitors need an app to receive their deposit?
No. Visitors could return eligible cups through Smart DRS stations and receive their deposit directly to a payment card without downloading an app or registering an account.
Planning reusable cup returns for a seasonal venue?
Smart DRS provides automated return stations for venues and events using reusable cups. Explore our reusable cup return solution or contact the Smart DRS team to discuss a setup suited to your venue’s operating hours, visitor flow and return volumes.