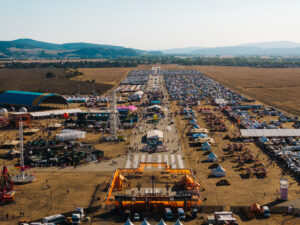
LOVESTREAM Festival 2026 in Bratislava welcomed 100,000+ visitors across three days, four stages and a 68-artist programme. This case study examines a reusable cup return system for festivals at scale. It shows how return demand changed as crowd flows shifted throughout the event.
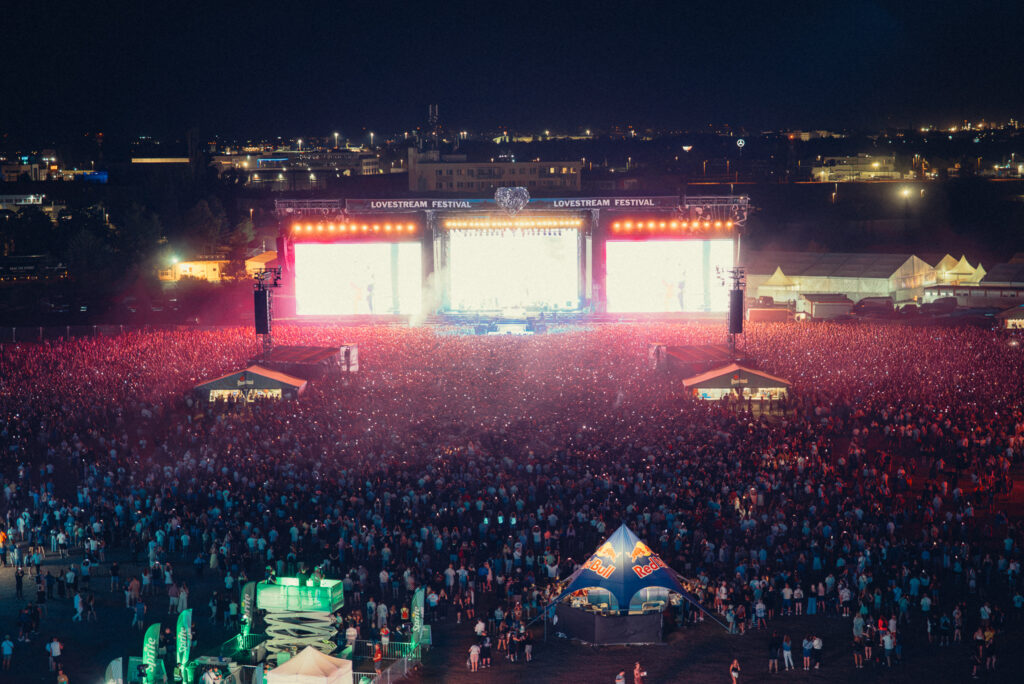
LOVESTREAM Festival 2026 provided a real-world test of the reusable cup return system for festivals at scale. With 68 artists performing across four stages over three days at the Old Airport Vajnory in Bratislava, Slovakia, the official timetable stretched into the early morning, with different stages finishing at different times. Smart DRS recorded 42,585 returned reusable cups across 21,427 collection sessions, showing how a large multi-stage festival generates changing cup-return demand throughout the evening and night.
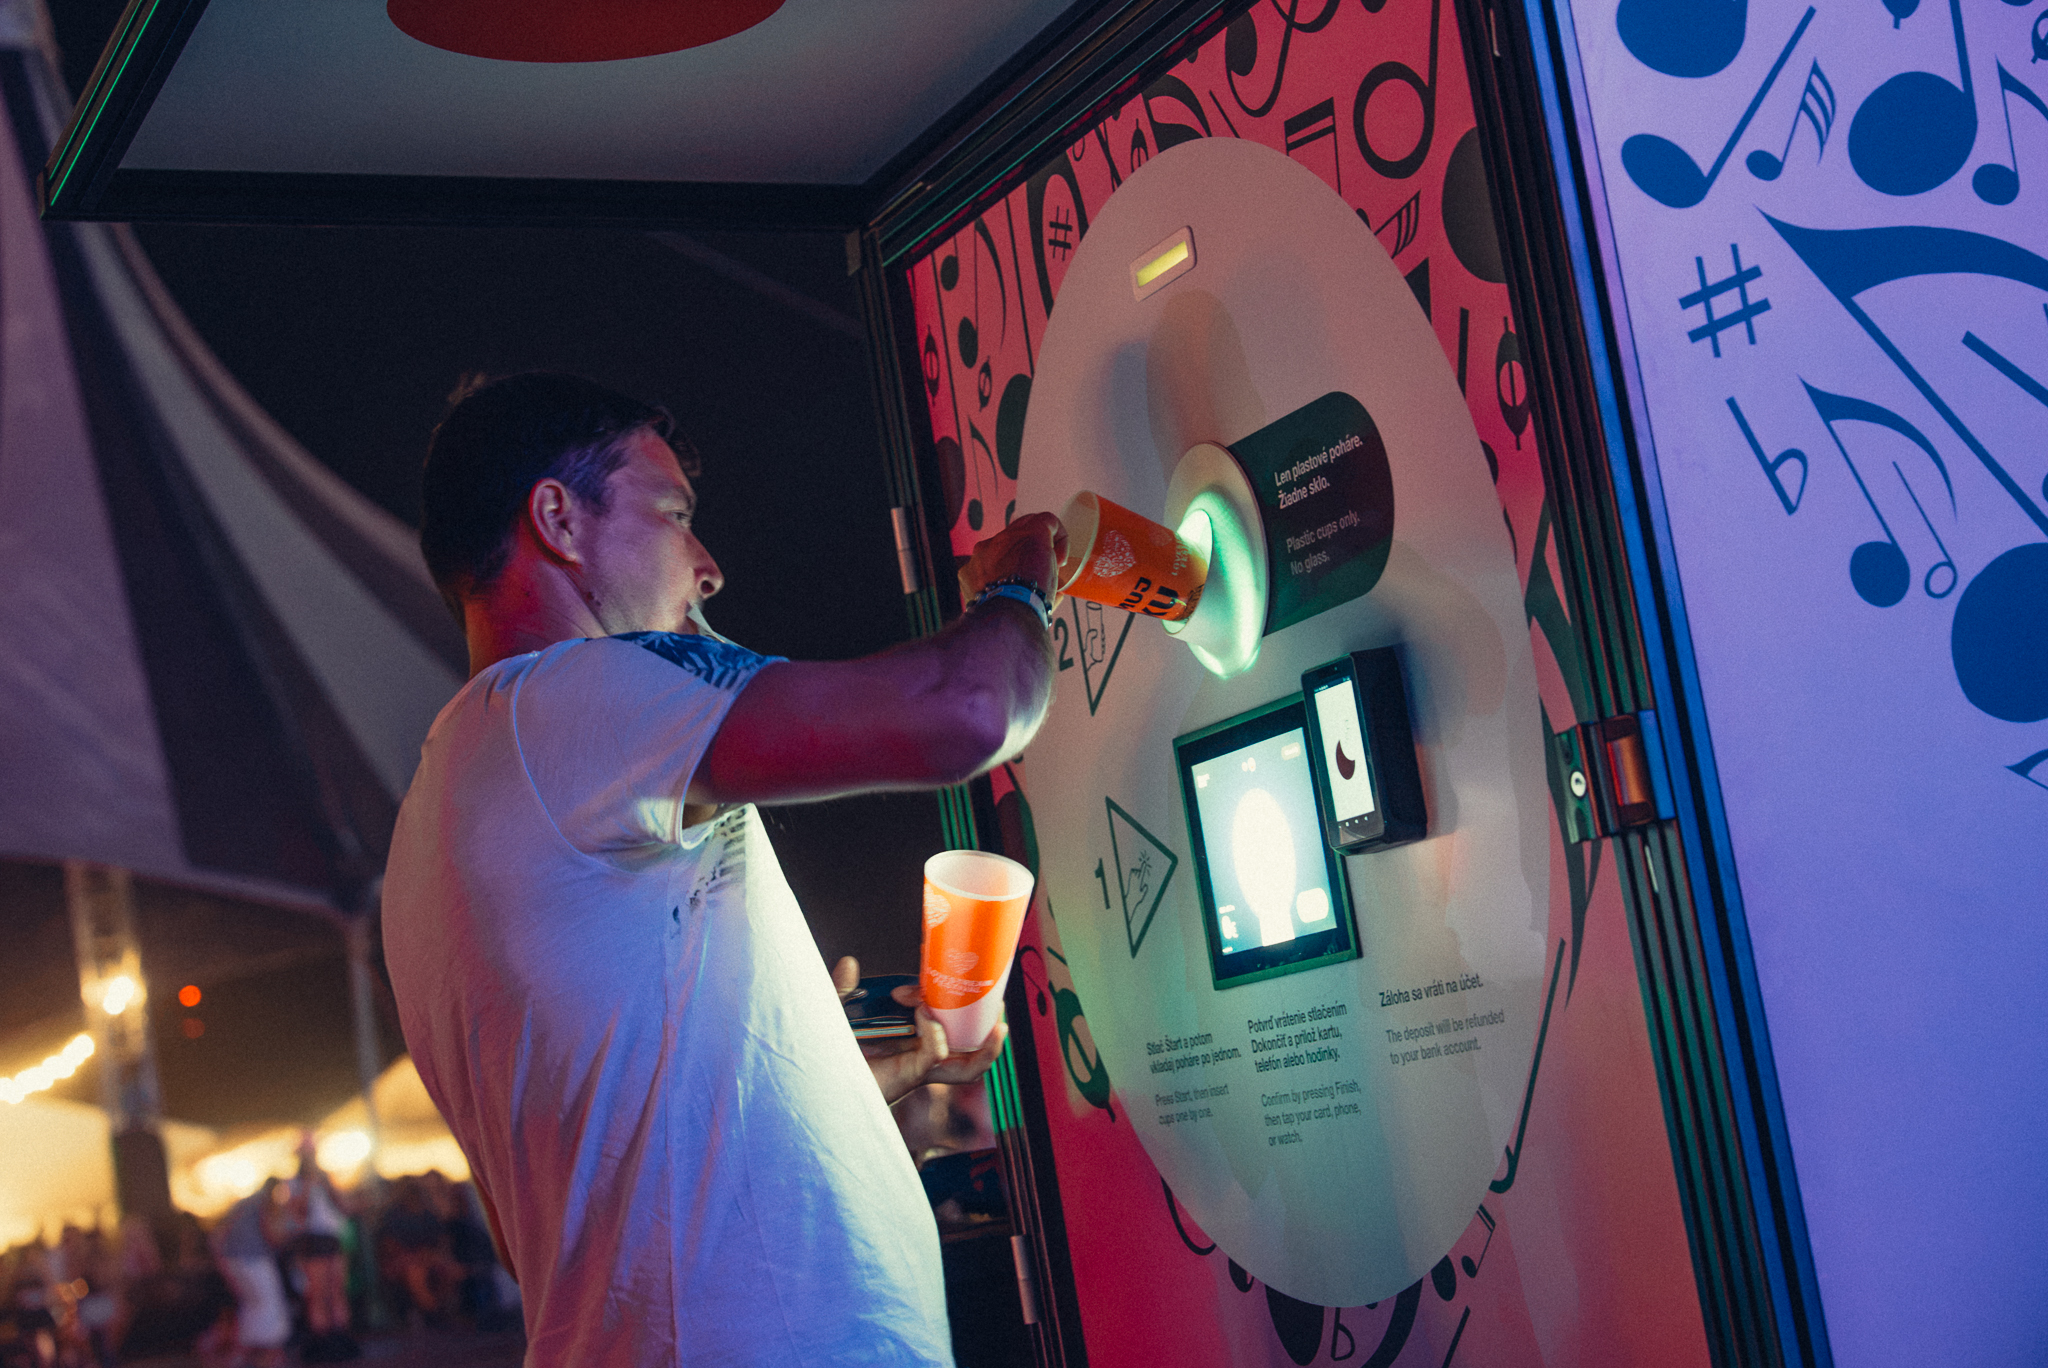
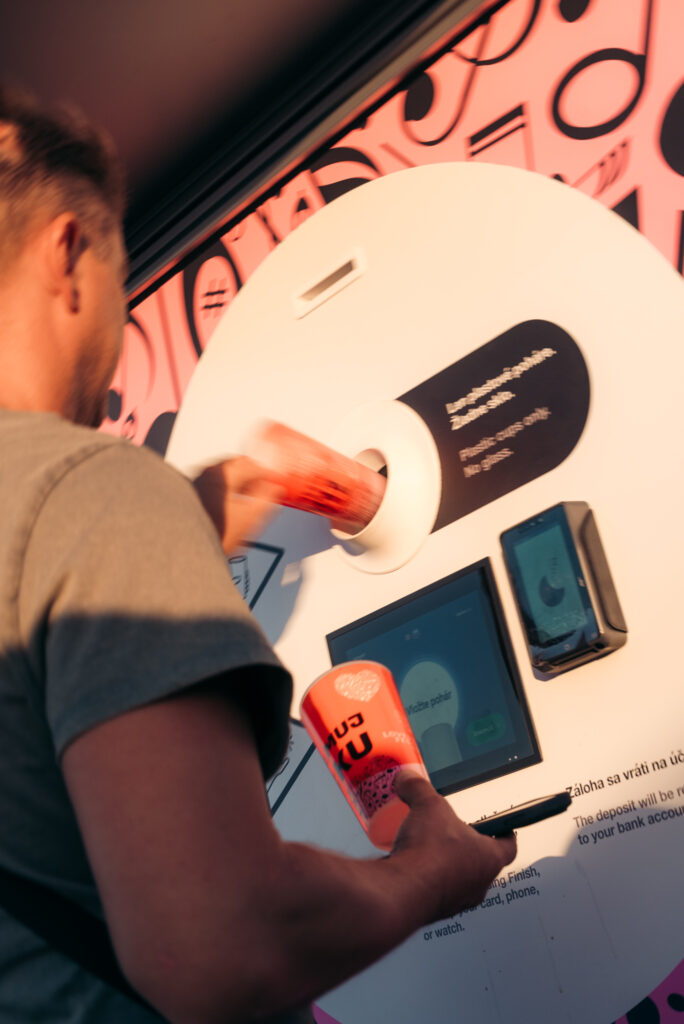
Festival guests can return eligible reusable cups through Smart DRS collection points. The full cup deposit is refunded directly to their payment card. The process requires no mobile app and no registration, removing two common sources of friction from deposit return systems.
The aggregated return curve shows several distinct waves rather than one single closing surge. Activity increased through the evening, formed a strong wave around 20:00–21:00 and reached its highest point around midnight before declining into the early morning. These are observed timing patterns; links to individual performances or visitor movements require programme-level and location-level verification.

LOVESTREAM 2026 in numbers
| METRIC | RESULT |
|---|---|
| Event Type | Three-day outdoor music festival |
| Event Date | 7–9 August 2026 |
| Location | Old Airport Vajnory, Bratislava, Slovakia |
| Programme scale | 68 artists across four stages |
| Late-night programme | Selected stages scheduled until approximately 03:00 |
| Festival attendance | 100,000+ in 3 days |
| Reusable cup type | Rigid reusable plastic cups |
| Deposit amount | €3 |
| Smart DRS collection points | 18 |
| Refund method | Instant payment card refunds |
| Total cups returned | 42,585 |
| Collection sessions | 21,427 |
| Average cups per return | 1,99 |
| Peak return period | Around 0:00 |
| Highest throughput | 4,002 collections/hour |
Reusable Cup Returns by Date
| DATE | COLLECTION SESSIONS | CUPS RETURNED | AVG. CUPS/SESSION |
|---|---|---|---|
| 7 August 2026 | 3,671 | 6,311 | 1.72 |
| 8 August 2026 | 7,014 | 13,659 | 1.95 |
| 9 August 2026 | 8,663 | 17,879 | 2.06 |
| 10 August – after midnight | 2,079 | 4,736 | 2.28 |
| Total | 21,427 | 42,585 | 1.99 overall |
The data shows a clear increase in return activity as the festival progressed. The highest calendar-day volume was recorded on 9 August, with 17,879 cups returned through 8,663 sessions. This represented 42% of all verified festival-period returns.Similarly, the average increased from 1.72 cups per session on 7 August to 2.28 after midnight on 10 August.
Key findings
Total returns: Smart DRS processed 42,585 eligible reusable cup returns during the verified festival period.
Collection sessions: Smart DRS recorded 21,427 collection sessions, with an average of 1.99 cups per session.
Strongest period: The aggregated hourly return curve reached its highest point around 00:00, with a peak throughput of 4,002 collection sessions per hour.
Payment performance: The dashboard recorded a 96.32% card success rate.
Distinctive pattern: Return activity developed in several waves, including a strong evening period around 20:00–21:00 and the largest peak around midnight.
Reusable Cup Return System for Festivals: The Scale Challenge
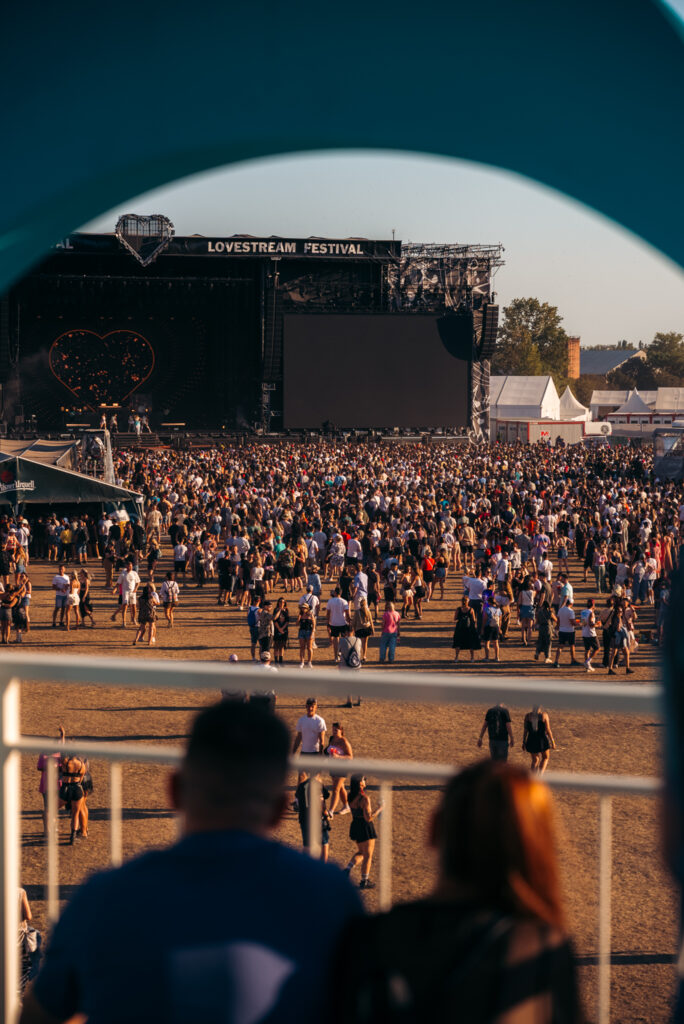
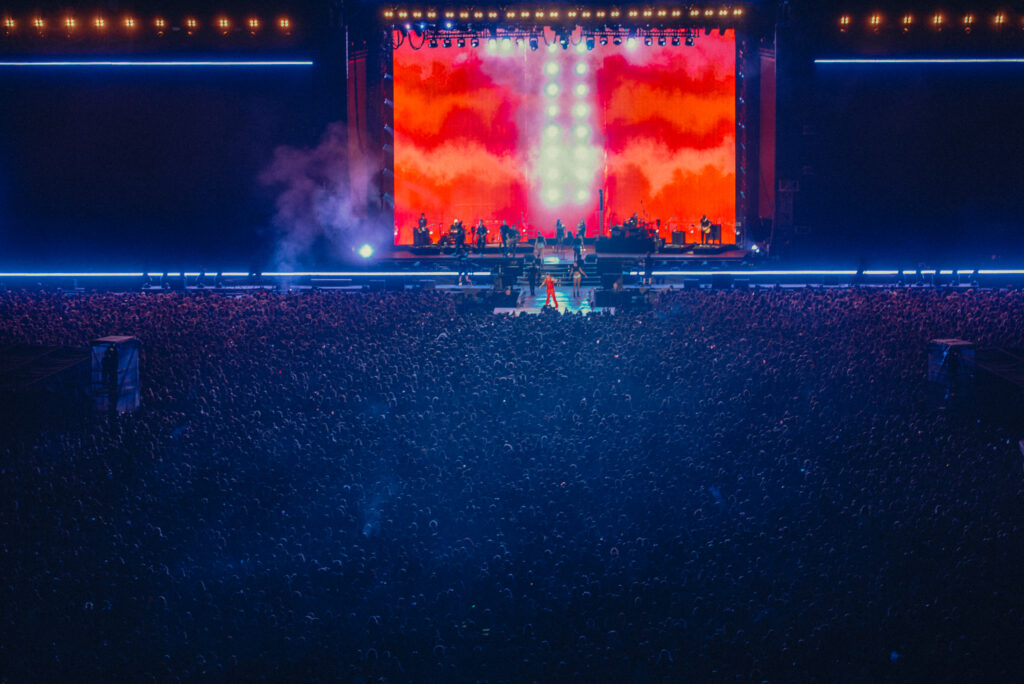
LOVESTREAM is not a single-stage event with one clear closing moment. Its 2026 programme spans four stages and continues to approximately 03:00. Main-stage headline sets finish around midnight, while electronic and club-oriented programming continues elsewhere on the site.
This staggered timetable creates several operationally different moments. These include movement between stages, returns after individual performances and a larger wave after the main headliner. Later returns may also come from visitors staying for the night programme. The challenge is therefore not only processing a large total number of cups. It is maintaining a simple return experience while demand changes by time, day and location.
For Smart DRS, LOVESTREAM offers an opportunity to study return infrastructure as part of a moving festival system. The key question is not simply, ‘How many cups did visitors return?’ It is also: ‘Where and when did return demand emerge, and what does that reveal about capacity and placement?’
The Solution: an Automated Reusable Cup Return System for Festivals
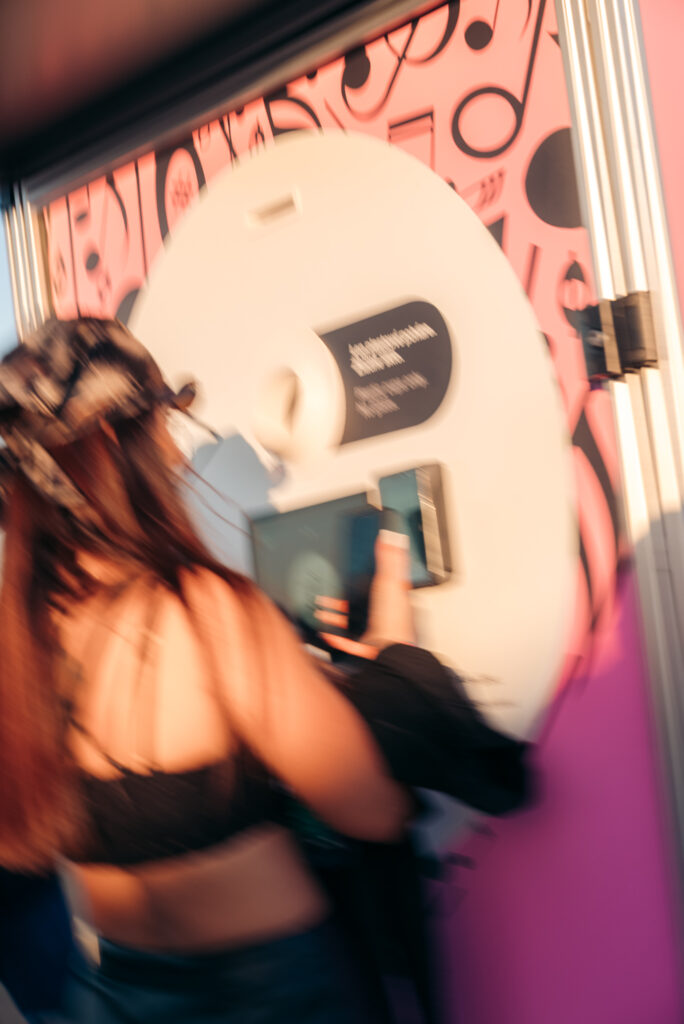
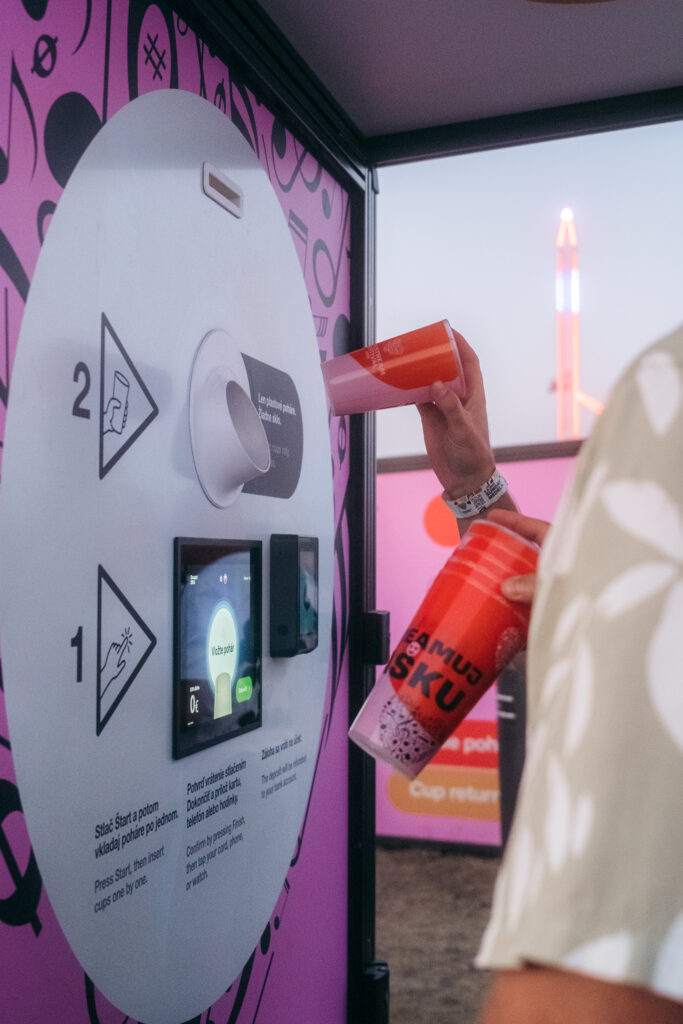
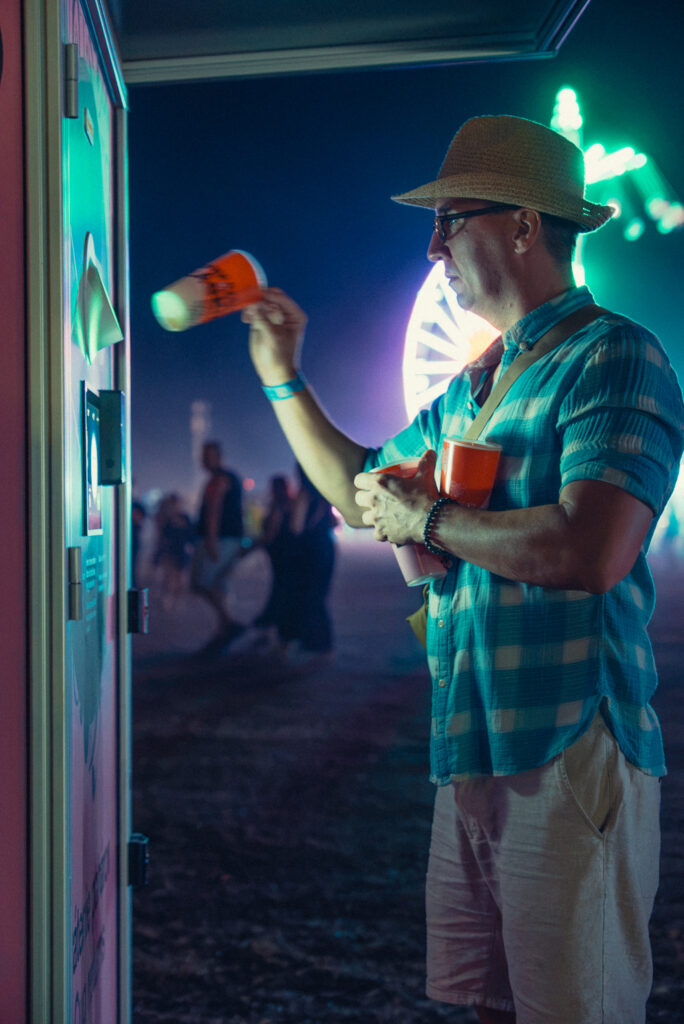
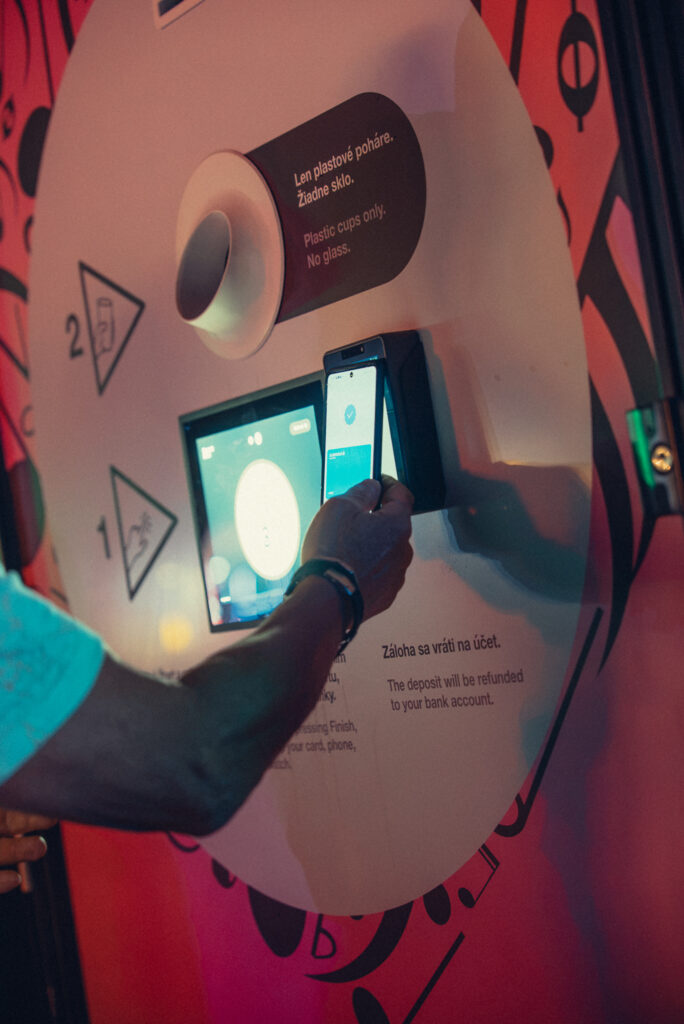
Smart DRS provides automated return infrastructure for reusable packaging. At LOVESTREAM Festival 2026, visitors could return eligible cups through Smart DRS automated reusable cup return stations positioned throughout the festival area. The visitor journey involved four simple actions:
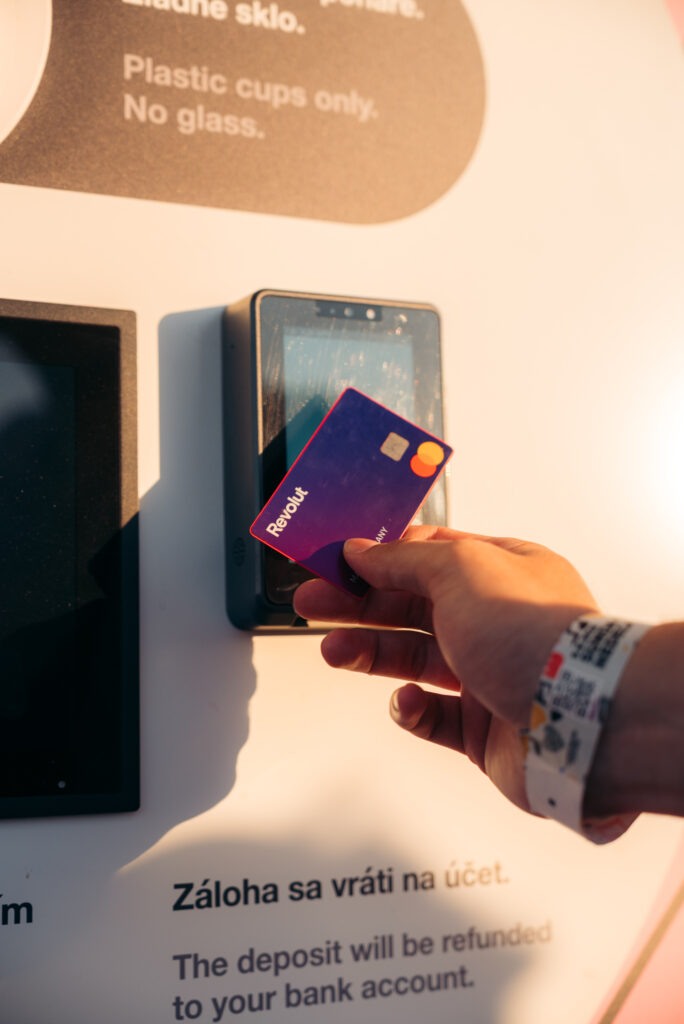
- Start the return process and present a payment card.
- Insert one or more eligible reusable cups into the return station.
- Allow the system to recognise, verify and accept the returned items automatically.
- Receive the full deposit refund directly to the payment card.
No app or registration. No manual refund handling.
By combining automated item recognition with payment card refunds, the system gives visitors a familiar way to recover their deposit while helping organisers collect traceable return data.
Reusable Cup Return System Deployment at LOVESTREAM
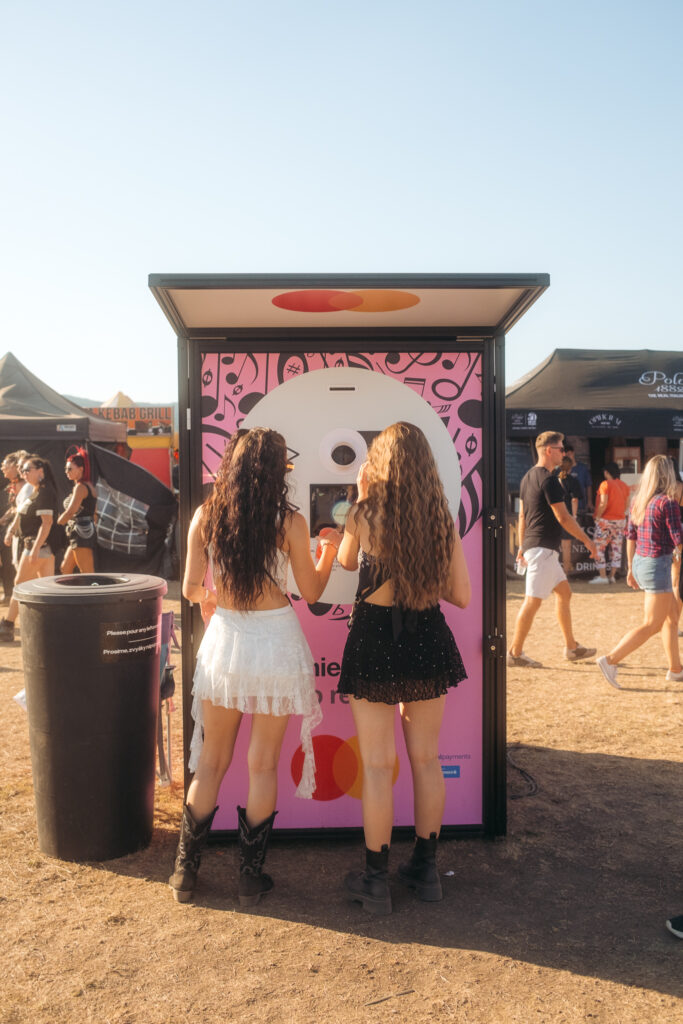
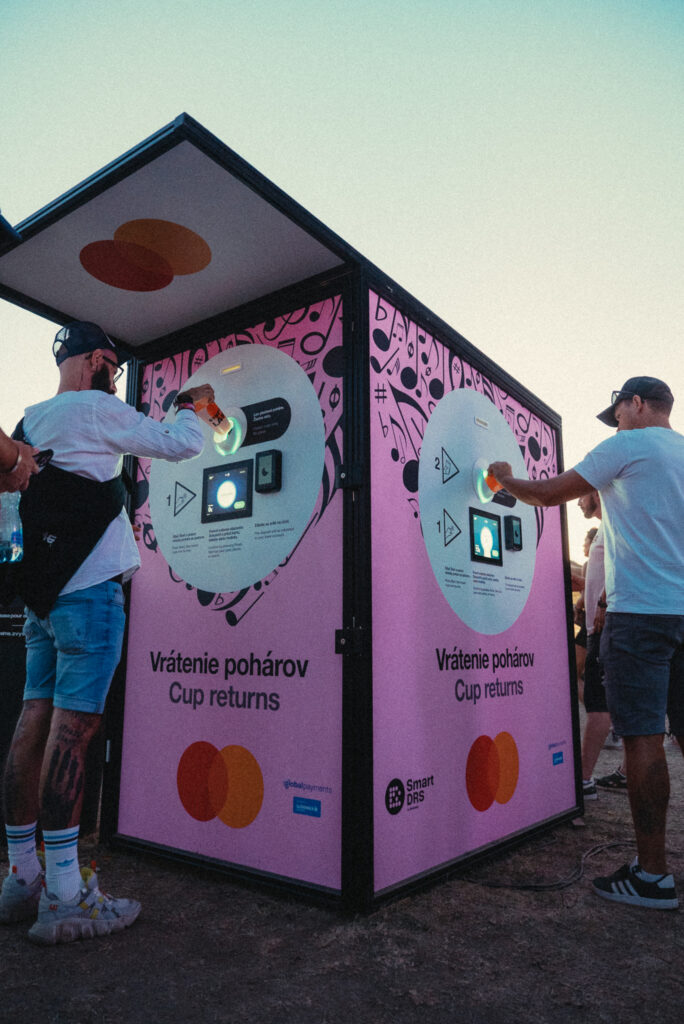
LOVESTREAM deployed the reusable cup return system to handle high and changing visitor volumes across a multi-day outdoor event. The Smart DRS dashboard recorded 9 two-lane Smart Collection Point return devices distributed across several festival zones, including the Booster/Lunapark area, the Electronic Stage, the main entrance and the Ferris wheel area. This distributed setup gave visitors access to automated cup returns from different parts of the festival site rather than concentrating the entire return flow in a single location.
Visitors could return eligible rigid reusable plastic cups and receive the full €3 deposit directly to their payment cards. Return activity continued into the late-night programme, with the aggregated hourly curve reaching its highest point around midnight and a peak throughput of 4,002 collection sessions per hour.
The location-level data also makes it possible to compare how individual devices performed across the festival site. The highest-performing device processed approximately 3,900 cups during the deployment, while return volumes varied considerably between devices. These differences provide practical evidence for future decisions about the number, capacity and placement of return stations near stages, visitor routes, beverage zones and exits.
From timetable to return map
One of the most distinctive LOVESTREAM findings is the time-and-location pattern of reusable cup returns. Organisers can compare Smart DRS timestamps with the public festival timetable and on-site observations to identify return waves without attributing individual peaks to specific artists or performances without supporting evidence.
The aggregated hourly data shows a gradual afternoon build-up, followed by a strong evening wave around 20:00–21:00. Return activity then declined temporarily around 23:00 before reaching its highest level around midnight, when the system recorded a peak throughput of 4,002 collection sessions per hour.
On 7 August, visitors returned 6,311 cups, followed by 13,659 on 8 August and 17,879 on 9 August — the highest daily total. After midnight on 10 August, visitors returned a further 4,736 cups as activity from the final festival night continued.These results show how return demand intensified as the festival progressed and remained significant beyond the main daytime programme.
The final analysis should answer:
- Did each day produce one dominant peak or several return waves?
- How did activity change before and after the main-stage headline set?
- Did returns continue while late-night stages remained active?
- Which return point handled the highest share of volume, and during which intervals?
- Did visitors return more cups per interaction later in the evening?
- Were the strongest patterns consistent across Friday, Saturday and Sunday?
This approach creates a more useful case study than a single headline number. It shows organisers how programme structure, site layout and visitor timing can be considered when planning reusable cup return capacity.
The Smart DRS Dataset:
The published dataset combines four complementary layers: verified festival-period totals, a calendar-day breakdown, an aggregated hourly return pattern and device-level distribution across 9 two-lane Smart Collection Point return devices. Payment-card performance adds a further operational layer to the analysis.
Read together, these data points make it possible to evaluate how return demand developed over time, whether the deployed infrastructure absorbed the strongest return waves and how usage differed across the festival site. The calendar-day and hourly views provide evidence for planning operating hours and capacity, while the device-level data can support future placement decisions once the device aliases are matched with the final site map.
More detailed 15- or 30-minute exports, confirmed station capacities and system-availability data would allow a more precise assessment of short peak intervals and infrastructure utilisation. Until those datasets are approved, conclusions should remain based on the verified daily totals, aggregated hourly pattern and confirmed payment performance.

Simple for visitors, useful for operations
The visitor experience remains deliberately short: use the collection point, return an eligible cup and receive the full deposit back to a payment card. No app or account is required. Behind that simple interaction, Smart DRS records the time, volume and location of returns.
This contrast is central to the LOVESTREAM story. Visitors do not need to understand the complexity of festival logistics, but organisers can use the resulting data to evaluate placement, capacity, collection schedules and support during the busiest intervals.
Key learnings from LOVESTREAM 2026
The Smart DRS deployment at LOVESTREAM Festival 2026 provides several practical lessons for planning an automated reusable cup return system at a large, multi-day music festival.
Opening-day demand is not a reliable benchmark
Return volumes increased substantially as the event progressed. The highest calendar-day total was almost 2.8 times higher than the total recorded on 7 August. The aggregated hourly data recorded the highest throughput around midnight, followed by a sharp decline after 01:00 and lower activity until approximately 03:00.
Return demand develops in multiple waves
Visitors did not wait for one final closing period to return their cups. Activity increased during the evening, eased temporarily and then rose again towards midnight. A similar concentration of late-evening returns was observed in the Smart DRS case study from Senecké leto, reinforcing the importance of planning for several separate demand waves rather than a single end-of-day peak.
Late-night operation is essential
The highest aggregated hourly throughput was recorded around midnight, followed by a sharp decline after 01:00 and lower activity continuing until approximately 03:00. At a festival with a late-night programme, reusable cup return stations need to remain available beyond the main evening performances.
Visitors returned more cups per session later in the event
The average increased from 1.72 cups per collection session on 7 August to 2.06 on 9 August and 2.28 during the post-midnight period on 10 August. This suggests that later returns were more frequently consolidated, which can affect station throughput, internal storage requirements and collection logistics.
Device utilisation was not uniform
The dashboard recorded activity across 9 two-lane Smart Collection Point return devices, with clear differences in collected volumes. Before the next edition, organisers should match device aliases with their physical positions at the Old Airport Vajnory site. This will help identify which locations near stages, beverage zones, visitor routes and exits attracted the greatest demand and where organisers could redistribute capacity.
Automated card refunds performed consistently at scale
A card success rate above 96% indicates that direct payment-card refunds can support high-volume reusable cup returns without requiring an app, account registration or manual cash handling. The same return model has also been successfully deployed at a large international sporting event, as shown in the 2026 IIHF U18 Championship case study. Operational planning should still include monitoring and a clear support process for the small share of unsuccessful transactions.
For future editions of LOVESTREAM Festival in Bratislava, the data supports a flexible deployment model: distribute return capacity across key visitor zones, prepare for increasing demand on later days, maintain full operation through the midnight peak and use device-level results to refine station placement.
What other large festivals can learn
Planning a reusable cup return system for festivals should not be based on attendance alone. Capacity also needs to reflect programme structure, visitor movement and periods of concentrated demand. As explained in the guide to returning reusable cups at scale, the effectiveness of a reusable system also depends on how easily visitors can access return infrastructure during periods of concentrated demand.
LOVESTREAM recorded several return waves across the evening and night, with the largest aggregated peak around midnight. The result shows why timetable structure, stage geography, visitor movement and late-night programming matter: two events with similar attendance may generate very different return curves and require different numbers or configurations of automated reusable cup return stations.
This case study gives organisers a practical framework: map likely crowd transitions, place return infrastructure along real visitor routes, measure activity by time and location, and use the evidence to refine the next deployment. The average of 1.99 cups per collection session also shows that capacity planning should account for visitors returning multiple cups at once. Smaller event deployments show similar behaviour. In the Smart DRS case study from Splanekor 2.0, visitors returned an average of 2.14 cups per collection.
These operational lessons are becoming increasingly relevant as reusable packaging expands across events and venues. The EU’s Packaging and Packaging Waste Regulation (PPWR) also reflects this broader shift towards reuse.
What This Means for Festival Organisers
The LOVESTREAM results demonstrate why organisers cannot calculate reusable cup return capacity from attendance alone. Event duration, programme structure, crowd movement, return-station placement and the number of cups returned per session all influence the infrastructure required. The Smart DRS guide to returning reusable cups at scale explains why convenient access to return infrastructure is as important as introducing reusable cups themselves.
For organisers, the next step is to translate the time- and device-level data into site-specific decisions. Organisers should match device aliases with the festival map, evaluate return capacity by visitor zone, and align storage, collection and operational support with periods of highest demand. The objective is not simply to deploy more automated reusable cup return stations, but to select the right configuration and placement for each part of the venue.
Moreover, comparisons with other deployments show that there is no universal setup for every event. At Splanekor 2.0, one Dual Smart Collection Point supported a one-day cultural event, while LOVESTREAM required a distributed multi-device deployment across a much larger festival site. This illustrates how operational data can help organisers adapt reusable cup return infrastructure to the scale, layout and programme of each event.

FAQ: Planning Reusable Cup Return Systems for Festivals
How should organisers estimate reusable cup return capacity?
Attendance alone is not sufficient. Capacity planning should also consider event duration, beverage sales, programme structure, venue layout, operating hours, expected return peaks and the average number of cups returned in one session. Historical data from similar events can provide a more realistic basis than visitor numbers alone.
Why is peak throughput more important than the total number of returned cups?
Return activity often follows the rhythm of the programme. Visitors may return cups between performances, while moving between stages, before leaving a zone or at the end of the night. Comparing return timestamps with the event timetable can help identify recurring patterns, although individual peaks should not be attributed to specific performances without supporting evidence.
Where should automated cup return stations be positioned?
Stations should be placed along real visitor routes rather than distributed evenly across the venue. Relevant locations may include routes between stages, beverage zones, entrances, exits and areas where visitors naturally pause. Device-level data can then show whether the original placement matched actual visitor behaviour.
Why can return volumes differ significantly between devices?
Differences may result from visibility, accessibility, surrounding foot traffic, proximity to beverage sales, programme timing or the direction in which visitors leave the venue. Low utilisation does not automatically mean that a device was unnecessary, but it should prompt a review of its position, signage and operating hours.
Which metrics should organisers monitor during a reusable cup programme?
Useful metrics include total cups returned, collection sessions, average cups per session, hourly return volumes, peak throughput, device-level utilisation, payment success, system availability and unresolved return attempts. Together, these indicators provide a more complete operational picture than a single total.
How should late-night returns be included in event reporting?
Post-event analysis can identify when additional capacity is needed, which locations attracted the most demand and whether devices should be moved or reconfigured. It can also inform staffing, technical monitoring, internal storage, cup collection, washing logistics and the operating hours of return infrastructure.
How can organisers compare reusable cup performance across different events?
Events should be compared using both absolute and relative indicators. Total returns can be considered alongside attendance, event duration, number of active devices, cups returned per session and peak throughput. This helps account for differences in venue size, programme format and visitor behaviour.
How can organisers compare reusable cup performance across different events?
Deposit refunds create a direct incentive for visitors to return reusable cups, helping increase return rates and maximise the environmental benefits of reuse systems.
Planning a Reusable Cup Return System for Festivals?
Successful reusable cup systems require more than enough cups and an estimated visitor count. Return capacity needs to reflect the event timetable, venue layout, visitor routes, operating hours and expected periods of peak demand.
Smart DRS helps festival and venue operators build automated, measurable reusable packaging return systems. Its AI-powered stations recognise eligible cups, process multiple items within one return session, refund deposits directly to payment cards and provide operational data for evaluating return activity—without requiring visitors to download an app, create an account or wait for manual refund processing.
Explore the Smart DRS automated reusable cup return solution or contact the Smart DRS team to discuss return infrastructure for your next festival, stadium, arena or public event.